Labour Market and Employment Services Update
The labour market and employment services caseloads are continuing to follow the COVID-19 pathway. Just about every graph that we look at reflects the COVID-19 experience:
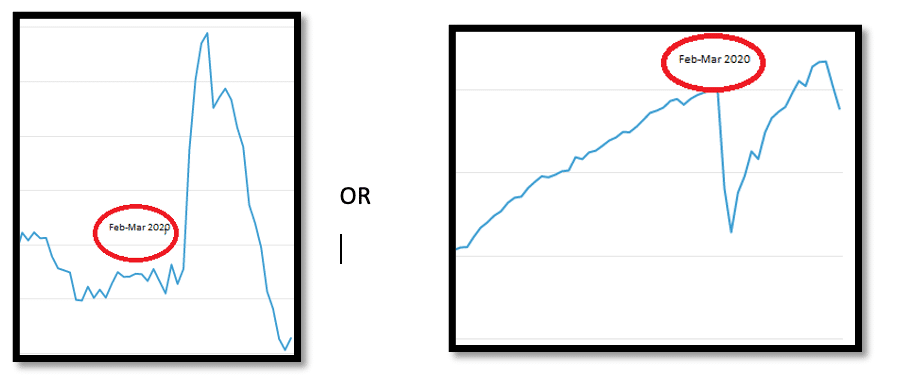
Regardless of what a graph shows, we tend to see COVID-19 phases: the initial and significant ‘shock’, a slow readjustment and trend back towards ‘normal’, and then a ‘second wave’ accompanied by prolonged lockdown to major economic areas.
The graph on the left is typical of most indicators of unemployment related activity – unemployment, underemployment and underutilisation. The graph on the right tends to be representative of most measures of employment activity, such as jobs, number of people employed, and hours worked.
In looking at employment and unemployment measures we can perhaps identify a few phases of COVID-19.
There’s the initial impact during the first months of 2020 as economic activity and employment falls. Unemployment, underemployment and underutilisation rates rise dramatically. This tends to be followed by a ‘new normal’, as the economy adapts to COVID-19 and we adjust to new ways of doing things. Many of us work from home. We ‘click and collect’ and have our purchases delivered. As regions emerge from initial lockdowns, businesses re-open with new COVID-19 restrictions and safety plans. The employment indicators that should point upwards start pointing upwards, and unemployment tends to reduce. But we know that this is not the end of the story. The indicators swing into reverse once again as the COVID-19 Delta variant drives Victoria, New South Wales and the ACT into extended lockdowns.
Our employment services caseloads have followed the same path – an initial shock where caseloads rise rapidly in response to growing unemployment is followed by a slower trend back towards pre-COVID figures, before caseloads rise again in 2021 as many significant labour markets return to prolonged lockdowns.
As we reflect on the 2020-21 reporting period, it is necessary to include some of the labour market and caseload data on either side of this time period to observe the trends between the first and second wave of COVID-19.
Let’s now look at some of the data around employment and caseloads.
Employment
 Source ABS
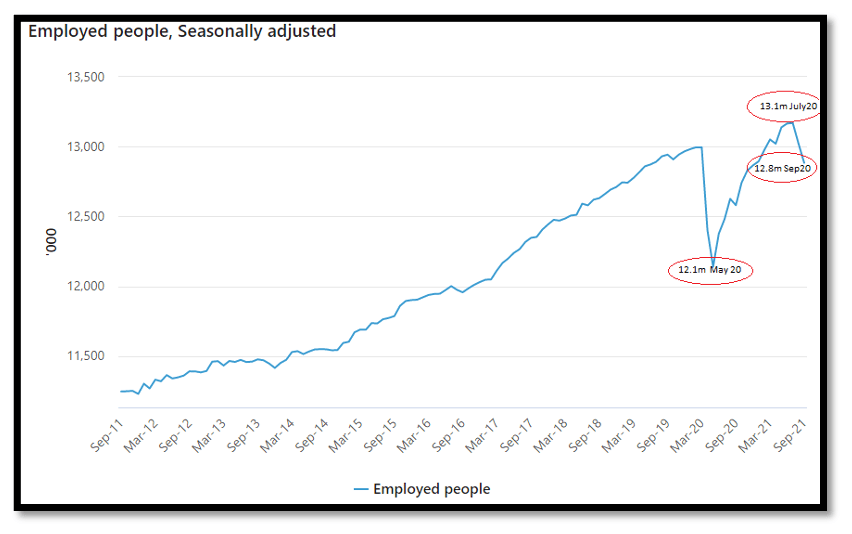
This is very much the COVID-19 story: a decade of employment growth peaking at 13 million employed persons in March 2020 and falling to just over 12 million just two months later. The gradual recovery saw the number of employed persons rise to an all-time high of 13.1 million in June 2021 before the ‘second wave’ of lockdown resulted in the number of employed persons dropping to 12.8 million in September 2021.
 Source ABS
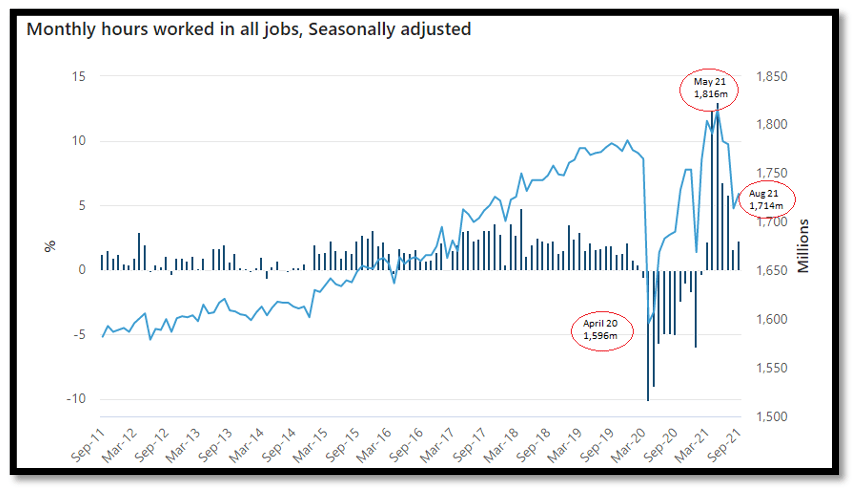
Like overall employment trends, hours worked peaked at 1,784 hours in November 2019 before falling to 1,596 million in April 2020. Consistent with the trend in employment, hours worked rose to 1, 816 million hours in May 2021 before falling to 1,714 million hours in August 2021.
Participation
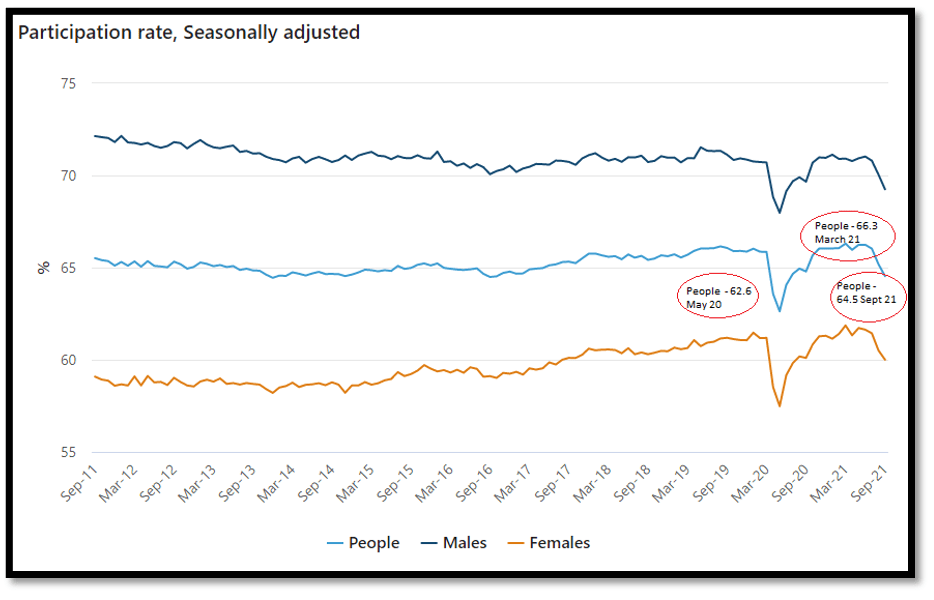 Source ABS
The Participation Rate, which over a long period has tended to stay close to 65%, fell to 62.6% in May 2020 before returning to 66.3% by March 2021. The second wave of COVID-19 saw the Participation Rate fall to 64.5% in September 2021.
Unemployment
Source ABS
Now we see the inverse graphs. The unemployment rate rose from 5% in December 2019 to peak at 7.4% in July 2020. It fell to 4.5% in August 2021 before edging up to 4.6% in September 2021. The Reserve Bank of Australia predicts unemployment to fall to 4% by the end of 2023.
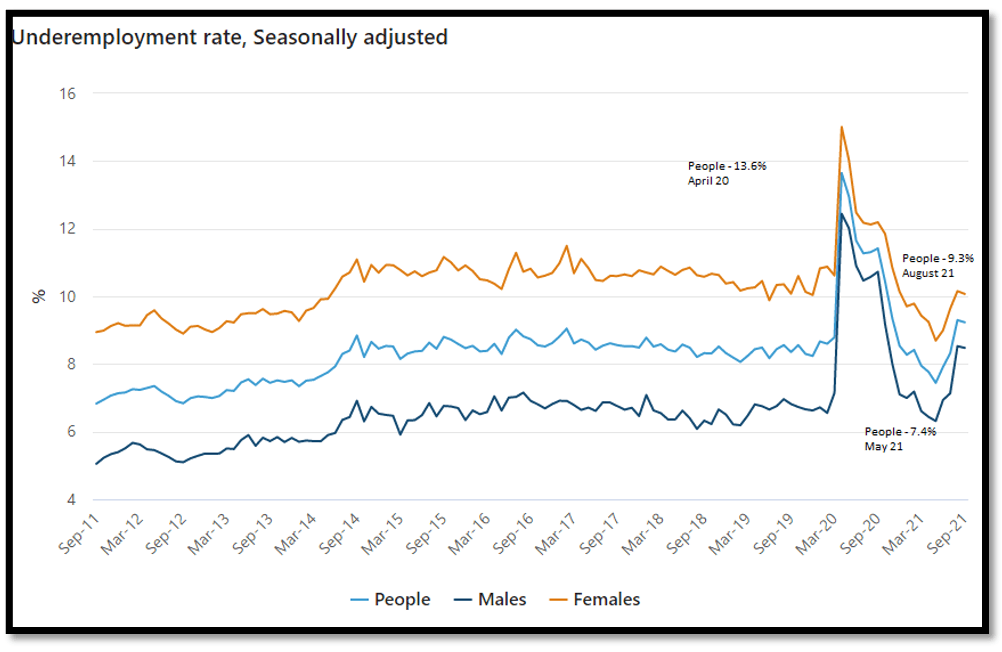
Source ABS
Underemployment measures combine those who work part-time but seek more hours, and those who are considered as full-time employees but are not currently working full-time hours, whereas underutilisation measures spare capacity within employed and unemployed persons. The underemployment rate fell to 7.4% in May 2021 before rising again during the ‘second wave’, reaching 9.3% in August 2021. Changes to underemployment tend to precede changes to the number of employed persons.
The jobactive Caseload and Online Employment Services
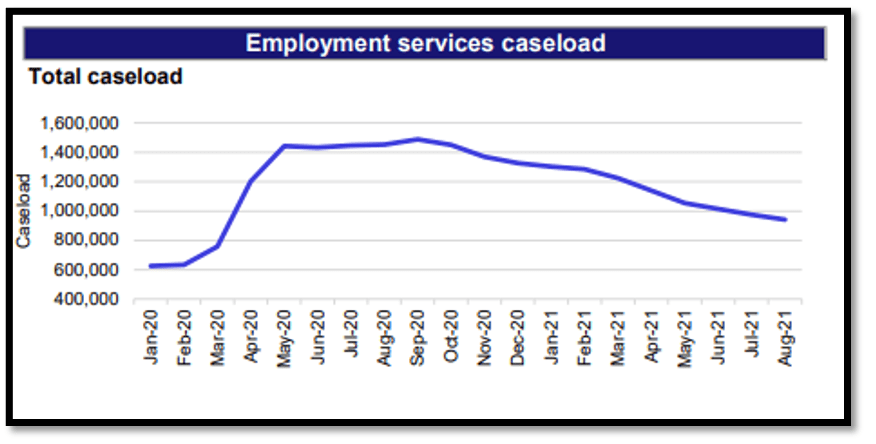 Source LMIP
A significant consequence of COVID-19 was an acceleration of referral to Online Employment Services, which ceased being a ‘trial’ in April 2020.
In December 2019 the number of participants in jobactive and Online Employment Services Trial totalled 606,286 and 7,085 respectively. By 30 June 2020 there were over 1.4 million participants in these services, including approximately 400,000 in Online Employment Services.
Post 30 June 2021, the services had 882,237 participants in September 2021, including 183,000 people in Online Employment Services.
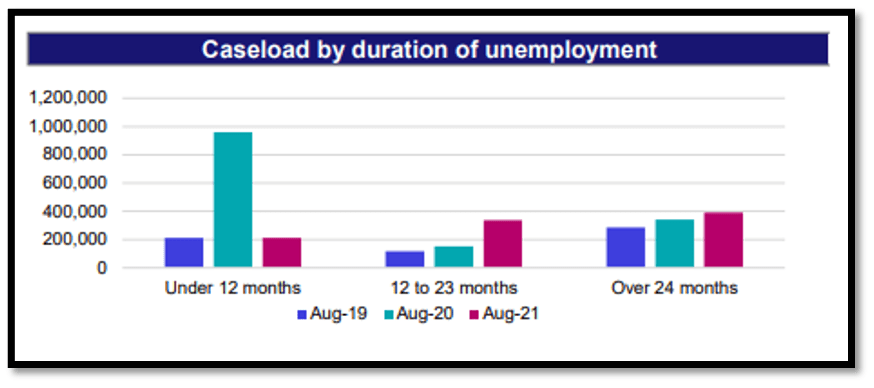 Source LMIP
The initial impact of COVID-19 is evident in the August 2020 figures: approximately 1 million participants have been unemployed for under 12 months.
So what might the year ahead look like post 30 June 2021?
In its Statement on Monetary Policy – August 2021, the Reserve Bank of Australia says:
“Recent outbreaks of the Delta variant across Australia, and the resulting lockdowns, have introduced a high degree of uncertainty to the outlook for the second half of this year. Activity will contract in the September quarter and some job losses are expected. Towards the end of this year, the economy is forecast to rebound from this setback as restrictions ease, as it has from previous lockdowns”
and
“ …the unemployment rate is forecast to decline steadily to around 4 per cent by the end of 2023. With considerable spare capacity likely to be absorbed by this time, wages growth and inflation is forecast to gradually pick up, with inflation forecast to be a little above 2 per cent by the end of 2023.”
Deloitte Access Economics Business Outlook, October 2021
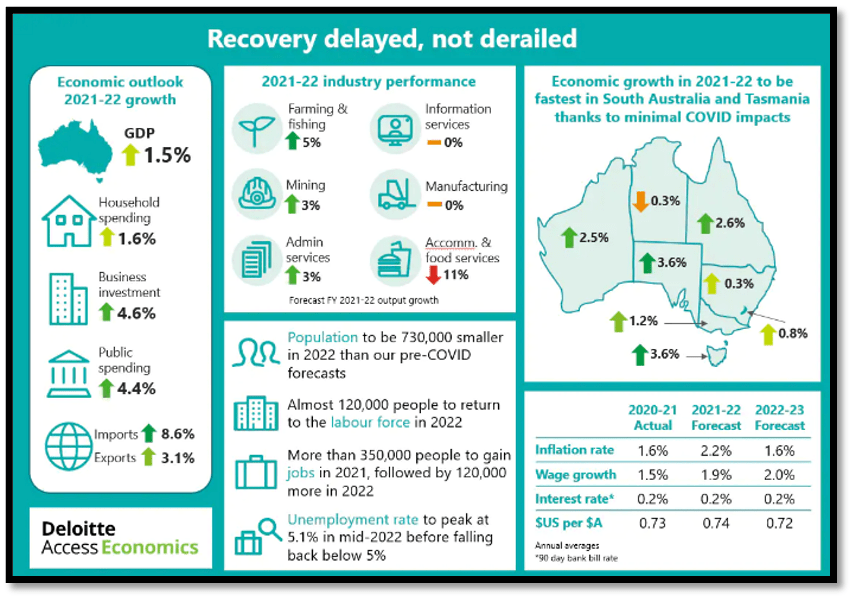
With the message of ‘recovery delayed, not derailed’, Deloitte gives us a snapshot of what recovery might look like in the next two years: